PuffiAir Local Data Visualization Setup Guide
This guide walks you through the full process from installing InfluxDB to displaying PuffiAir sensor data on a webpage.
🧱 Step 1: Environment Preparation
sudo apt update
sudo apt install -y python3 python3-pip curl
Install Mosquitto MQTT Broker (or use Home Assistant's built-in MQTT service)
If you're already using Home Assistant and have MQTT enabled, you can use its built-in MQTT broker.
In this case, simply enter the MQTT settings of your Home Assistant instance (host, port, username, and password) into the PuffiAir configuration web page (AP mode).
⚠️ Note: You should either use Home Assistant's MQTT or a local Mosquitto server—not both. Choose one and ensure the MQTT settings in PuffiAir match the broker you are using.
sudo apt install -y mosquitto mosquitto-clients
sudo systemctl enable mosquitto
🌊 Step 2: Install and Configure InfluxDB 2.x
curl -sL https://repos.influxdata.com/influxdb.key | sudo gpg --dearmor -o /etc/apt/trusted.gpg.d/influxdb.gpg
echo "deb [arch=amd64] https://repos.influxdata.com/ubuntu $(lsb_release -cs) stable" | sudo tee /etc/apt/sources.list.d/influxdb.list
sudo apt update
sudo apt install influxdb2
sudo systemctl enable influxdb
sudo systemctl start influxdb
Open the setup UI in your browser: http://<your_ip>:8086
Initial setup values:
- Organization: puffilab
- Bucket: puffiair
- Token: Save this token for later
- Username / Password: Used for web access
🐍 Step 3: Python Script - MQTT → InfluxDB
Install Python dependencies
pip3 install paho-mqtt influxdb-client
Create the script file mqtt_to_influx.py
import json
from paho.mqtt.client import Client
from influxdb_client import InfluxDBClient, Point
from influxdb_client.client.write_api import SYNCHRONOUS

INFLUX_URL = "http://xxx.xxx.xxx.xxx:8086"
INFLUX_TOKEN = "your_token"
INFLUX_ORG = "puffilab"
INFLUX_BUCKET = "puffiair"

MQTT_BROKER = "localhost"  # or your HA MQTT IP
MQTT_PORT = 1883
MQTT_TOPIC = "puffiair/data"

influx_client = InfluxDBClient(
    url=INFLUX_URL,
    token=INFLUX_TOKEN,
    org=INFLUX_ORG
)
write_api = influx_client.write_api(write_options=SYNCHRONOUS)

def on_message(client, userdata, msg):
    try:
        data = json.loads(msg.payload.decode())
        print("Received:", data)
        point = Point("sensor")
        for k, v in data.items():
            try:
                point.field(k, float(v))
            except ValueError:
                continue
        write_api.write(bucket=INFLUX_BUCKET, org=INFLUX_ORG, record=point)
    except Exception as e:
        print("Error:", e)

mqtt = Client()
mqtt.connect(MQTT_BROKER, MQTT_PORT, 60)
mqtt.subscribe(MQTT_TOPIC)
mqtt.on_message = on_message

print(f"Subscribed to topic: {MQTT_TOPIC}")
mqtt.loop_forever()
Run the script (keep this running):
python3 mqtt_to_influx.py
📊 Step 4: Build a Simple Frontend Dashboard (optional)
Create an HTML file:
<!DOCTYPE html>
<html>
<head>
  <meta charset="utf-8">
  <title>CO₂ Chart</title>
  <script src="https://cdn.jsdelivr.net/npm/chart.js"></script>
</head>
<body>
  <canvas id="co2Chart" width="800" height="400"></canvas>
  <script>
    const token = 'your_token';
    const org = 'puffilab';
    const bucket = 'puffiair';
    const url = `http://xxx.xxx.xxx.xxx:8086/api/v2/query?org=${org}`;
    const fluxQuery = `
      from(bucket: "${bucket}")
        |> range(start: -6h)
        |> filter(fn: (r) => r._measurement == "sensor" and r._field == "co2")
        |> sort(columns: ["_time"])
    `;

    fetch(url, {
      method: 'POST',
      headers: {
        'Authorization': `Token ${token}`,
        'Content-Type': 'application/vnd.flux',
        'Accept': 'text/csv'
      },
      body: fluxQuery
    })
    .then(res => res.text())
    .then(csv => {
      const lines = csv.trim().split('\n').filter(line => !line.startsWith('#'));
      const timestamps = [];
      const values = [];
      for (let line of lines) {
        const parts = line.split(',');
        const time = parts[5];
        const value = parseFloat(parts[7]);
        if (!isNaN(value)) {
          timestamps.push(new Date(time));
          values.push(value);
        }
      }

      new Chart(document.getElementById('co2Chart'), {
        type: 'line',
        data: {
          labels: timestamps,
          datasets: [{
            label: 'CO₂ (ppm)',
            data: values,
            borderColor: 'rgba(75, 192, 192, 1)',
            borderWidth: 2,
            fill: false,
            pointRadius: 0,
          }]
        },
        options: {
          scales: {
            x: { type: 'time', time: { unit: 'hour' }, title: { display: true, text: 'Time' }},
            y: { title: { display: true, text: 'CO₂ (ppm)' }}
          }
        }
      });
    })
    .catch(err => console.error(err));
  </script>
</body>
</html>
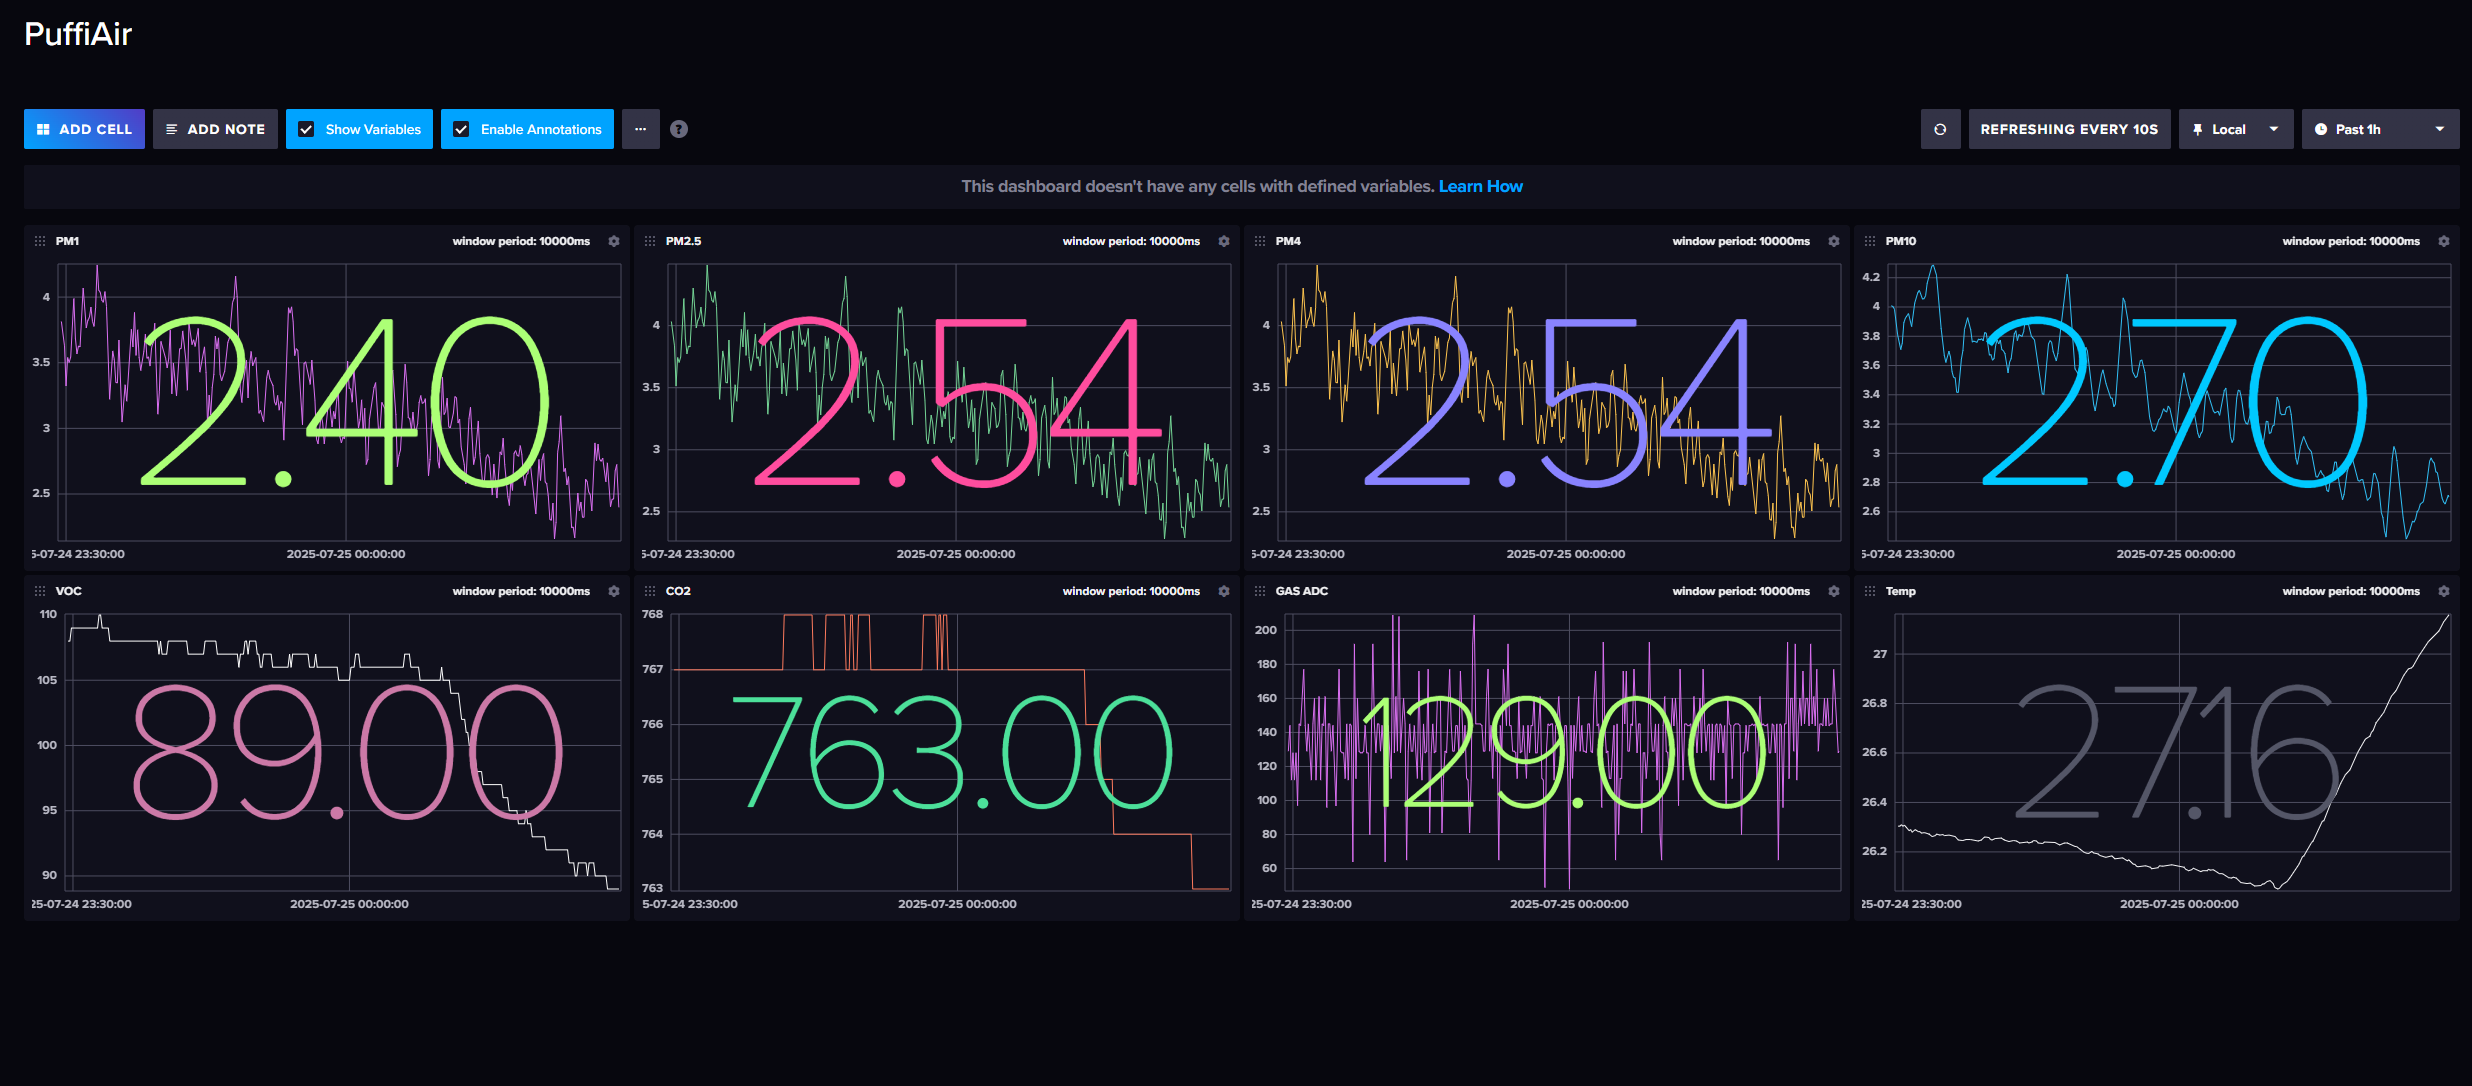
✅ Done!
Your PuffiAir is now logging to InfluxDB and viewable in browser.